
Over the last four years, politics has been at the forefront of most newscycles. With the upcoming presidential election, the 2020 cycle has garnered significant attention and massive fundraising hauls. Just yesterday, the Democratic presidential nominee, Joe Biden, announced that his campaign had raised a whopping $364.5 million in August alone. This shattered the prior Democratic monthly record held by former President Barack Obama, who raised more than $190 million in September 2008.
Windfall is a data company, and we take pride in digging into complex topics. Our team posed two key questions for the new political fundraising landscape:
- How has fundraising evolved over the last 3 presidential election cycles?
- Where is the money coming from?
Specifically, we wanted to understand how high net worth (“HNW”) households, defined as those with more than $1 million in wealth, impact the overall fundraising landscape.
Focusing on Individual Contributions
For our analysis, Windfall filtered for individual contributions directly to candidates, the RNC or DNC, and specific committees linked to the candidates like Act Blue and WinRed. We excluded contributions to unaffiliated PACs and removed contributions from organizations. Given the lag in having a complete picture of public reporting, our data analyzes FEC contributions through June 30, 2020.
By looking at this data, which includes contributions to both Republican and Democrats, we can see that generally, the peaks for fundraising follow presidential election cycles:
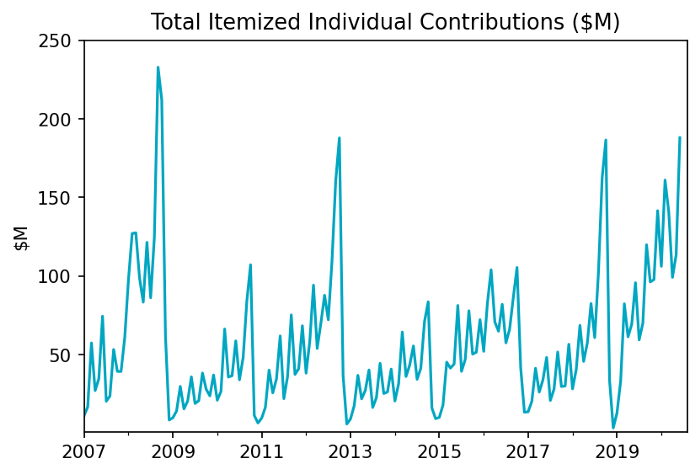
Interestingly, 2018 is a bit of an anomaly. While we do see small peaks in the midterm election cycles, the peak of 2018 matched the presidential election peak from 2012 and massively surpassed midterms in 2010 and 2016. Windfall captured this in our article on how HNW households drove 2018 out-of-state political fundraising with more than $2 billion raised for candidates running for congress.
Moreover, if we look at this current cycle, we are nearing peaks from 2012 and 2018. Totals tallied below do not yet include the aforementioned fundraising totals from August 2020, which will meaningfully change the scale of our graph. The turbulence in the current political climate is certainly leading to the rise of individual contributions this year.
We wanted to dig in further and segment this by major political parties:
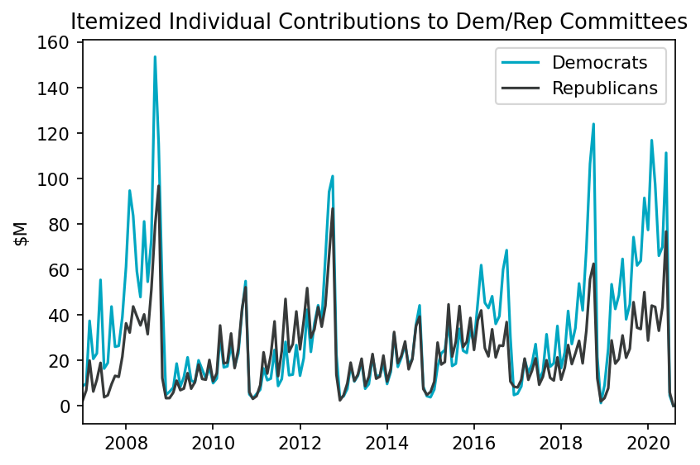
Here, we can clearly see the fundraising efforts in 2008 for Barack Obama and in 2018, the surge of Democratic fundraising for the midterms. Democratic fundraising has been strong in the last two years, but this aggregates all contributions to presidential candidates, not just the nominee Joe Biden.
Looking at this current presidential cycle, we wanted to understand, regardless of political party, where geographically the money is originating:
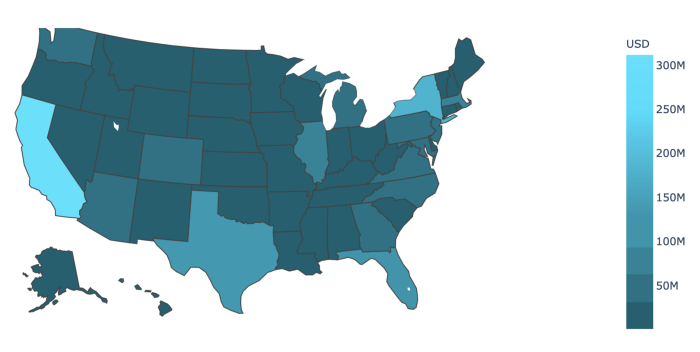
Overall, this almost looks like a population graph, since California is the most populated state in the country. Given the population, and the fact that California leans left, it makes sense that with the massive hauls for the Democratic party that it would rise to the top. That being said, it is surprising that other top states by population Texas (rank #2) and Florida (rank #3) do not appear to have as large of an impact on the overall political fundraising landscape. Since smaller states won’t show up on this analysis, we wanted to understand how the same analysis looks on a per capita basis:
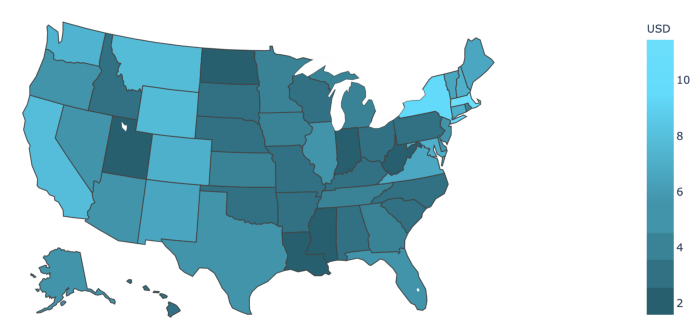
Here we can see California, while still high on the list, normalizes, and other states start to bubble up, including Massachusetts and Montana. Anecdotally, this makes sense, since, for example, Steve Bullock (D) a two-term Governor of Montana is running for Senate.
We can see that 2020 represents an unprecedented fundraising environment for political candidates, with local contributors impacting national races with major dollars. This is a dramatic change from just 12 years ago, and if the trends continue to hold, will represent the “new normal” moving forward.
Are HNW Individuals Driving Fundraising?
At Windfall, our vision is to determine the net worth of every person on the planet and help organizations become more data driven. When defining net worth, we think about a household’s personal balance sheet: assets — liabilities. We’ve written other articles on how we think about this methodology including the stock market’s impact on wealth and IPOs generating household wealth.
To start answering our question, we first wanted to understand if HNW individuals across the country were contributing to the two major political parties:
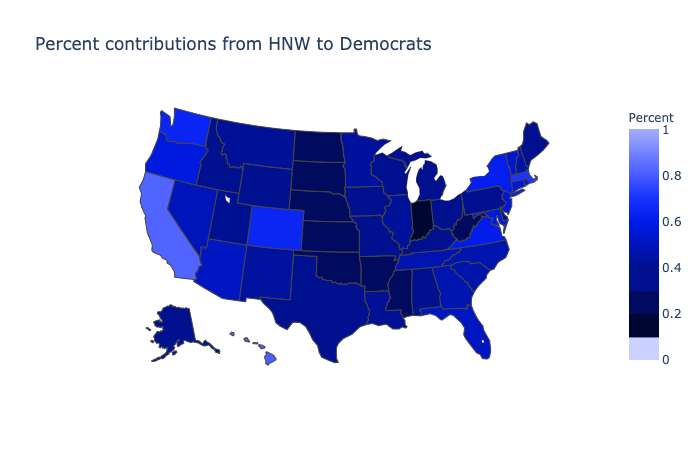
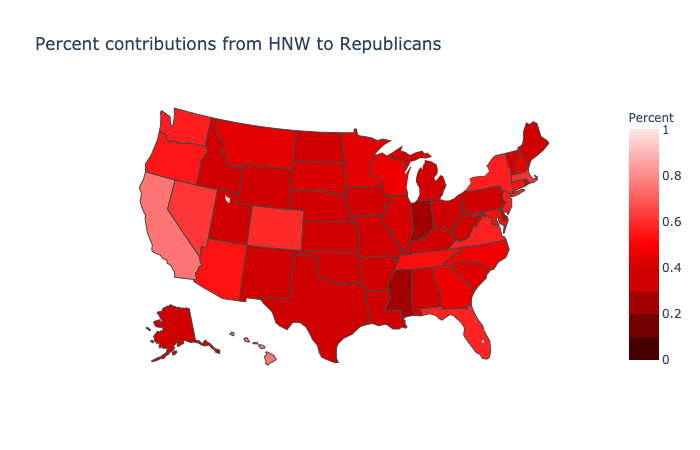
While there are “blue” and “red” states when you look at a map holistically, there doesn’t seem to be a significant difference across the US. For example, California HNW individuals contribute the most to both Republicans and Democrats.
Similar to our original analysis, we wanted understand if HNW donations followed the same trends as overall individual contributions:
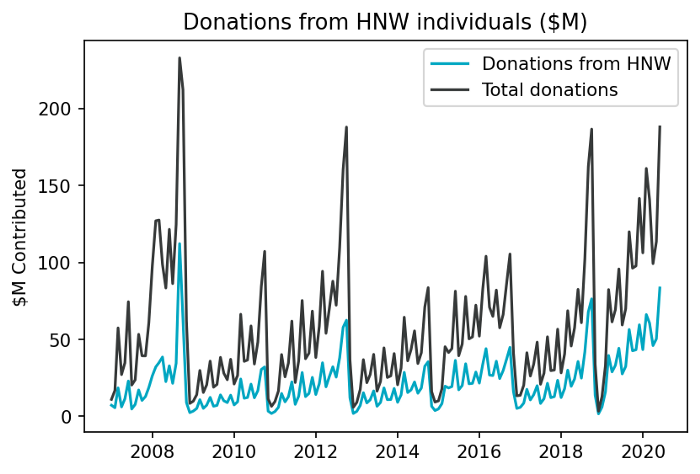
Indeed, we can see the influence that HNW individuals have on overall contributions. Since HNW individuals are a subset of the overall line graph, the trends overlap. That being said, by looking at just the blue line, we can see that the same peaks and valleys are not always as extreme, indicating more consistent giving by HNW contributors during the course of election cycles.
While this was helpful for setting the benchmark, we still wanted to understand: are HNW individuals contributing at a higher rate?
By looking at the percent of dollars across individual fundraising, we can start to get a better understanding of this trend:
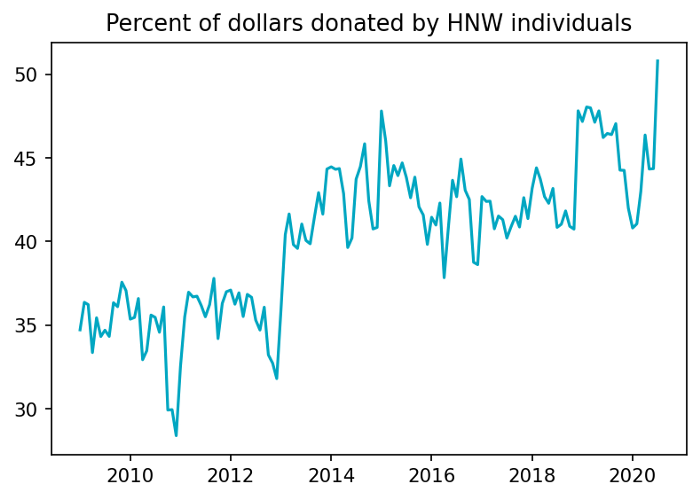
While just a decade ago, HNW individuals were only contributing ~35–40% of the total dollars raised by individuals, this number is trending up and to the right. Thus, while HNW households comprise ~10–15% of the US population, they are responsible for 50% of total dollars contributed by individual.
Will this trend hold? Or did something else happen in this election cycle? We wanted to understand overall contributions versus how many weeks were left in the election:
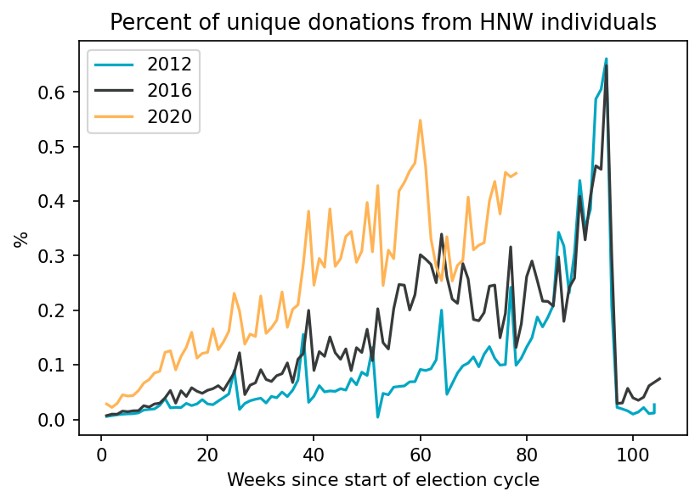
It appears that HNW individuals are participating earlier than in prior election cycles and at a stronger pace. While we would anticipate large dollars very close to the end of an election cycle, much more money has been funneled into the 2020 campaign. Please note that the dropoff in HNW contributions is most likely due to COVID-19 and the spectrum of lockdowns across the US.
Given what we have seen in recent fundraising announcements from Biden and Trump, we believe that the end of this election cycle will see the largest peaks than the prior two elections.
Conclusion
Politics has captured the attention of many Americans. We started this article by asking two questions: (1) How has fundraising evolved over the last 3 presidential election cycles? (2) Where is the money coming from?
From our analysis, it is clear that individual fundraising has increased significantly not only for presidential elections but also for midterm elections (see 2018). High net worth individuals are driving a lot of this growth and are accounting for a larger proportion of overall contributions, regardless of party.
If you found this post interesting, please consider following our blog where we analyze various trends in a variety industries, the economy, and political landscape. If you are interested in learning how this data could be relevant for your company, please reach out to the Windfall team.
This article was authored by Arup Banerjee, CEO and Co-founder, and Chris Ferraioli, Senior Data Scientist, using a combination of FEC and Windfall data.
Source: FEC, data as June 30, 2020. We exclude donations with missing information, e.g. no state. Items with a ‘memo code’ are excluded as these contributions have been redesignated or otherwise are not to be included in aggregate totals. Windfall is only able to include itemized contributions.
About Windfall:
Windfall helps you identify, understand, and engage the affluent. We provide you with precise net worth data on affluent US households, allowing you to make informed data-driven decisions.